Garden Variety Trophic Pyramid
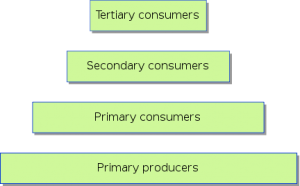
Here is one’s garden variety trophic pyramid. It shows a hierarchical relationship of consumption (i.e. a food chain) as well as a quantity of biomass or an amount of energy production at each level.
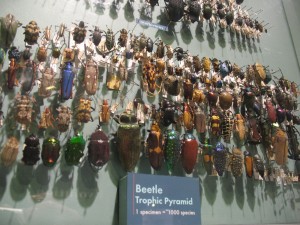
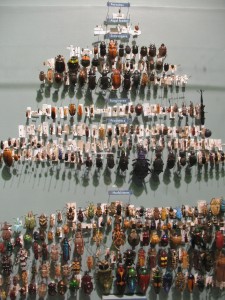
Here’s how the Harvard Museum of Natural History does it – with real beetle carcasses stuck into a surface with tacs instead of bars or icons. It’s a physical information graphic.
The hierarchy in this food chain is complicated since it’s not a simple A eats B eats C relationship. Here we have herbivores, fungivores, algal feeders, which would all seem to be on the same level since they all consume primary producers. And where does one place the parasites? In this case, on top. But perhaps the predators consume the parasites while the parasites feed on the predators in return?
In any case, this piece allows the viewer to drill down to infinite detail with the actual beetles chosen. It makes me want to play with wood type or otherwise create something graphical using physical objects.

